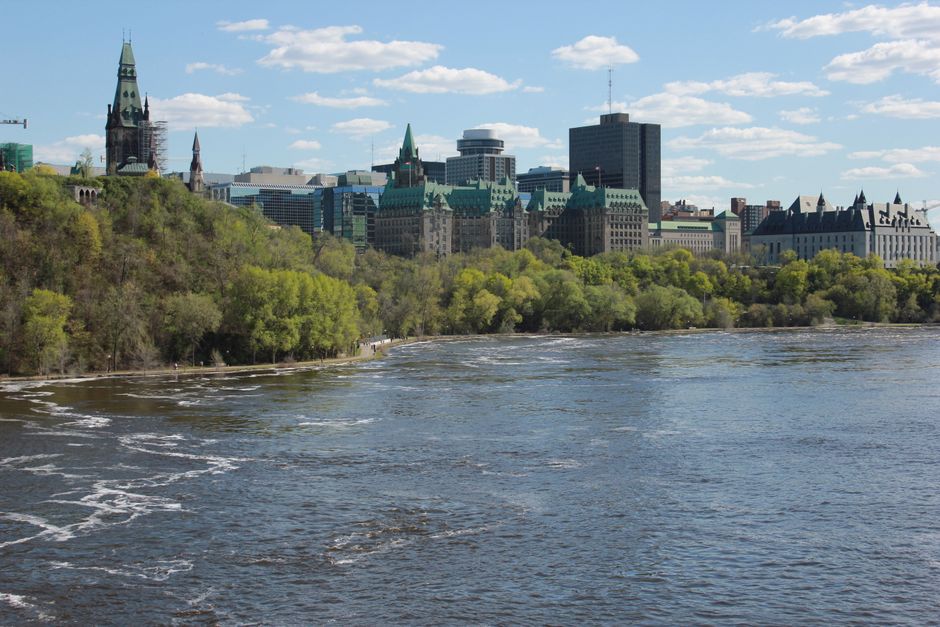
Ottawa Neighbourhood Map Guide: Where to Zoom In for Your Next Home
Finding the right home in Ottawa takes more than a good listing. The house matters, but so does the community around it. Commute times, school catchments, nearby amenities, and the general character of an area all trace back to where one neighbourhood ends and another begins. That is why a solid Ottawa neighbourhood map guide is one of the most useful tools a home buyer can have.
The challenge is that neighbourhood boundaries are not always obvious from the street. Official lines often follow waterways, historical property divisions, or major roads that do not match what residents assume. Different sources draw the lines differently. The good news is that Ottawa has some excellent map resources, and most of them are free to use. This guide explains what they are, how to read them, and how to put them to work for your next move.
Why an Ottawa Neighbourhood Map Matters for Home Buyers
Neighbourhood names show up everywhere in real estate. Listings use them, price reports use them, and conversations with friends and family certainly use them. But a neighbourhood name only means something if everyone agrees on the boundaries. In Ottawa, the Ottawa Neighbourhood Study (ONS) created its neighbourhood boundaries specifically to analyse population statistics. That work gives the city a consistent set of lines that researchers, planners, and the public can rely on.
For home buyers, that consistency is practical. When you see a house listed in Hintonburg or the Glebe, you can check the official boundary to confirm it really sits in that community. You can also compare average house prices across neighbourhoods without worrying that one source is using different lines than another. A map that shows boundaries clearly keeps the numbers honest.
There is also a simpler reason to study the map: orientation. A map helps you see how a neighbourhood connects to the rest of the city. Where are the closest bridges, transit routes, and major employers? Is the area close to the water or set back from it? These details shape daily life, and they are much easier to grasp when you can zoom in and explore the city visually.
The Two Generations of ONS Boundaries
The Ottawa Neighbourhood Study has published two boundary files that are freely available through Open Data Ottawa. The Gen 2 file is the historical set, published in 2019. It includes 111 neighbourhood boundaries, from Bayshore to Woodhaven. The Gen 3 file, published in 2024, is the updated set of boundaries. Both are available online, and Carleton University’s MacOdrum Library provides access to them alongside a direct download option for a 2012 version from its licensed server.
Why does the distinction matter? Because neighbourhood lines change over time. A report from one year may reference the Gen 2 boundaries, while newer data uses Gen 3. If you are comparing statistics or price information from different periods, knowing which generation the data uses helps you avoid confusion. For everyday browsing, the Gen 3 map is the one to start with, since it reflects the most current boundaries.
The raw data files are useful for researchers, but most home buyers will prefer the interactive map versions. Open Data Ottawa lets you explore the Gen 3 boundaries directly in your browser. You can zoom in to see exactly where the lines fall relative to streets, parks, and individual properties.

Where to Find Interactive Ottawa Neighbourhood Maps
Several interactive tools can help you explore Ottawa’s neighbourhoods, and each one has a slightly different strength.
The ONS website hosts its own neighbourhood map. You can pan around the city and zoom in and out freely. A dropdown menu lets you choose a specific data indicator to display, and you can switch between a map view and a bar chart view. That makes it easy to see how things like population characteristics vary from one part of the city to another.
Open Data Ottawa provides the official ONS boundary layers. The interface is built for exploration: you click on different sections of the map to get to the boundaries of different neighbourhoods. It is a straightforward way to confirm which neighbourhood a particular address or street falls within.
The Ottawa Real Estate Board offers a district neighbourhood locator through its map tool. You can search for a property in the search bar, and the tool identifies the district and neighbourhood associated with that location. This is especially handy when you are reviewing listings and want to verify the neighbourhood name attached to a property.
For a less formal perspective, Hoodmaps is a crowdsourced map of Ottawa. Residents and visitors tag areas by categories such as cool, tourists, rich, normies, suits, and uni areas. The labels are subjective and unofficial, but they can give you a quick, sometimes entertaining sense of how people view different parts of the city. Treat it as a conversation starter, not a data source.
Neighbourhoods Worth Zooming Into
Ottawa has many vibrant neighbourhoods, and the city’s tourism resources highlight several that are worth exploring on the map. The ByWard Market is one of the best-known areas, packed with shops, restaurants, and nightlife. Chinatown and Little Italy sit close together, each with its own cultural identity and dining scene. Hintonburg has earned a reputation for its main street and community feel. The Glebe draws people with its older homes and tree-lined streets.
These marquee neighbourhoods get a lot of attention, but they only scratch the surface. The ONS boundary set covers far more ground, from established suburban communities to newer developments. A useful approach is to start with a shortlist of neighbourhoods that fit your lifestyle, then use the interactive map to see how they connect to the places you visit regularly.
Using Neighbourhood Profiles to Compare Areas
Boundary maps tell you where a neighbourhood is, but they do not tell you what it is like. For that, the Ottawa Neighbourhood Study offers detailed neighbourhood profiles. On the ONS site, you can click the dropdown menu with the house icon and select a neighbourhood from the list. A button labelled “Visit” appears, and clicking it opens the full profile for that area.
The ONS has published publicly available datasets organized by neighbourhood, and you can choose a specific indicator from a dropdown menu to view. The visualization options include a map and a bar chart, so you can compare areas side by side or focus on a single neighbourhood in detail. Since all of this data is tied to the same boundary set, the comparisons are consistent across the city.
For home buyers, this information is a practical screening tool. Before you book a showing, you can check whether an area aligns with your priorities. The data can help you narrow your search to a handful of neighbourhoods, then let the map guide your visits.
Practical Tips for Exploring the Map
Start with the official sources. The ONS Gen 3 boundaries on Open Data Ottawa are the most current and reliable lines available. Use them to confirm the neighbourhood name for any property you are considering.
Drill down to find details. Interactive neighbourhood maps are designed to be explored at different scales. Zoom out to see how the city fits together, then zoom in to see where boundaries meet streets and landmarks. Clicking on individual sections reveals the neighbourhood names and boundaries.
Combine map tools for a fuller picture. Use the ONS map for official boundaries and data, the Ottawa Real Estate Board locator for property-specific queries, and a crowdsourced map like Hoodmaps for a sense of local character. Each tool fills a different gap.
Check the generation of any data you compare. If you are looking at reports from different years, confirm whether the neighbourhood boundaries used are Gen 2 or Gen 3. The difference can affect how the numbers line up.
Frequently Asked Questions
How do I find the official boundaries for an Ottawa neighbourhood?
The official boundaries come from the Ottawa Neighbourhood Study, and the Gen 3 file is freely available through Open Data Ottawa. You can explore it in your browser by zooming in and clicking on different sections of the map. If you have a specific address in mind, the Ottawa Real Estate Board’s district neighbourhood locator lets you search for the property and see which neighbourhood it falls within.
What is the difference between the ONS Gen 2 and Gen 3 maps?
The Gen 2 file is the historical set, published in 2019, and it includes 111 neighbourhood boundaries from Bayshore to Woodhaven. The Gen 3 file, published in 2024, is the updated boundary set. If you are comparing neighbourhood data from different years, it helps to know which generation the data uses, since the lines can differ between the two versions.
Is the Hoodmaps crowdsourced map accurate?
Hoodmaps is a crowdsourced tool where people tag areas with informal categories like cool, tourists, rich, normies, suits, and uni areas. The labels reflect contributors’ opinions rather than official data. It can give you a general sense of a city’s character, but it should not replace the official ONS boundaries when you are making a home-buying decision.
Can I use ONS data to compare neighbourhoods before buying?
Yes. The ONS site lets you choose a specific indicator from a dropdown menu and view it as a map or a bar chart. The data is organized by neighbourhood, and you can also visit individual neighbourhood profiles by selecting an area from the house icon dropdown. Because the data uses the official ONS boundaries, the comparisons are consistent across the city.
